June 29, 2014

Pan-Homo split: 11-17 million years ago

Chimpanzee mutation rate is largely determined by fathers' age and, overall, implies a Pan-Homo divergence rate of ~13 million years (95% CI: 11-17 Ma), about double than usually assumed by conservative scholastic inertia.

Oliver Venn et al., Strong male bias drives germline mutation in chimpanzees. Science 2014. Pay per viewLINK [doi:10.1126/science.344.6189.1272]

cc Matthew Hoelscher
The focus of this study are the important differences between patrilineal and matrilineal mutation rate depending on the father's age among chimpanzees, notably more biased than among humans. However the resulting estimate for Pan-Homo divergence is not less important because it radically challenges the usual assumptions of 5-7 Ma, repeated once and again in molecular clock estimates, which are based on studies that are already quite obsolete.

In the studied captive population of Western chimpanzees 30 out of 35 mutations happened in the paternal lineage, and these increase with the father's age. No effect could be attributed to maternal age or familiar peculiarities.

Interestingly most of these patrilineal mutations happen near the telomeres, an effect not seen in female line mutations.

Owing to this gender bias, the mutation rate of the X chromosome among chimpanzees is 74% that of autosomal DNA (in humans: 85%). 

The gender bias in mutation rate and its differential with humans is attributed to differences in mating systems among great apes, with chimpanzees having the greatest competition among males, what is reflected in testicle size. They predict that gorillas (who experience less competition between males) will show less patrilineal mutation rate bias than humans and chimpanzees.

This is probably the more synthetic paragraph from the study:
Under a model in which the mutation rate increases linearly with parental age, the rate of neutral substitution is the ratio of the average number of mutations inherited per generation to the average parental age. We predict the neutral substitution rate to be ~0.46 × 10⁻⁹ per base pair (bp) per year in chimpanzees, compared to estimates in humans of ~0.51 × 10⁻⁹ bp−1 year−1 (9). These results are consistent with near-identical levels of lineage-specific sequence divergence (12) but surprising given the differences in paternal age effect. In the intersection of the autosomal genome accessible in this study and regions where human and chimpanzee genomes can be aligned with high confidence, the rate is slightly lower (0.45 × 10⁻⁹ bp−1 year−1) and the level of divergence is 1.2% (13), implying an average time to the most common ancestor of 13 million years, assuming uniformity of the mutation rate over this time (95% ETPI 11 to 17 million years; table S11).


13 million years of the hominid line

This is not at all the first study to highlight the extreme dubiousness of the usual scholastic assumptions regarding the Pan-Homo divergence, which taint so many genetic studies, turning their chronological estimates totally worthless.

In 2010, Wilkinson et al. estimated a Pan-Homo divergence rate of 8-10 Ma. In 2012 Langergraber et al. recalibrated previous studies getting a Pan-Homo divergence bracket of 6.78-13.45 Ma (fig.2), while the divergence from Gorilla would be significantly older: 8.31-20.0.

Fig. 1 from Langergraber 2012. Legend: Diagram illustrating the branching pattern and timing of the splits between humans, chimpanzees, bonobos, western gorillas, and eastern gorillas. The paler shading indicates the range of split times inferred in this study. Cartoon skulls indicate approximate age of the indicated fossil remains, but do not imply that these fossils were necessarily on those ancestral lineages or that entire crania actually exist for these forms.


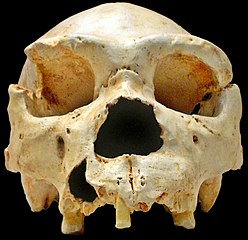
A key fossil affecting this controversy is Sahelanthropus tchadiensis (Toumaï), which has been recently confirmed to be in the human line on several hardly questionable traits and is dated to c. 7 Ma.

A related debate is whether primates in general are much older than usually claimed and lived already in the Jurassic, something suggested by the already mentioned Wilkinson study and also by Heads 2010. Here a major issue is that mainline conservative estimates would have the ancestors of New World monkeys swimming (island hoping) to South America, something that those monkeys (and most other primates) simply will not do. The radiation of primates to South America and possibly also Madagascar is much better explained if these animals could just tree-hop, rather than island-hop to their destinations. However this would demand a radical revision of the usual age estimate for vertebrate radiation, what so far lacks fossil support (but lack of evidence is not evidence of lack, you know: fossil ages can only be taken as terminus ante quem dates and not absolute direct references).

But this is a side question, what really matters to us is that our ancestors split from the chimpanzee line c. 13 Ma (according to this study) and not after 8 Ma in any case (weighting all the evidence). This not just renders most "molecular clock" estimates useless and effectively false (wrong, erroneous, inadequate, misleading, junk, pseudoscientific...) but also help us to rethink our ancestral history in the African savannas since long before we became humans (Homo sp.)

Looking for some ecological context clues, I found this 1996 study by Jean Maley, which shows that Africa was largely humid in the early Miocene (smectite: evidence of water) but that it became increasingly arid towards the middle Miocene (kaolinite: evidence of sand). Up to this key ecological change of the Middle Miocene, the rainforest extended all the way to Egypt and East Africa. This kind of ecology allows for the common ancestor of African great apes to have arrived and first diverged in a jungle-dominated ecology and, later, for the speciation event leading to humans (bipedalism) to have happened as this once widespread jungle became scarcer, yielding to deserts and savanna.

Sahelanthropus (from fossilized.org)
It just makes all sense that the evolution of bipedalism was coincident with the vanishing of that originally widespread jungle environment whose dating is of approx. 13 Ma ago. However it must be said that the consolidation of the Sahara only happened much later, c. 7 Ma ago, already approaching the Pliocene.

Regardless of the exact split-time, a big question I have on hominid evolution is how on Earth did our small-brained and small-toothed precursors like Toumaï survive in the open savannas and grasslands without fire nor weapons. Even if they resorted to trees (isolated or in patches) for refuge, there were already felines of the saber-toothed family roaming in Africa and these big cats were no doubt be able  to climb on trees and in some cases they have been shown to predate on australopithecines. How could our precursors in the hominin line be able to face this menace without the advantage of speed (as ruminants have) or good defenses? Were their strong forelimbs, together with team action enough to confront the threat of predators? Did they use primitive weapons such as branches and stone throwing?

June 21, 2014

Claim of 13 Ma Pan-Homo split

[Update (Jun 29): new entry on this issue available].

[Update: the origin of this news is Venn 2014 but I could not find the mention of the 13 Ma split initially, as it was not something they underlined at all. I will write something as soon as possible. Thanks to all the people who helped my confused mind].

Live Science reports this week that the divergence of the human and chimpanzee lines may be as old as 13 million years. This is the oldest range of what Langergraber 2012 suggested (8-13 Ma in Fig.1, although in text they wrote "6.8-11.6 Ma") and older than the Wilkinson 2010 estimates (8-10 Ma), and would totally break all the usual "molecular clocks" so extremely abused in human genetics because it is double of the usual scholastic mindless parroting (5-7 Ma, which are necessarily too recent because they do not allow for Sahelanthropus' evolution and not even for bonobo evolution under the protection of the mighty Congo river).

Sadly the article includes no reference to the source, not even the name of the scientists involved, and I could not find it any reference online. For a moment I thought it could be another new study on gender bias in chimpanzee mutation rate (Venn et al. 2014 (ppv)) but after getting a copy it does not seem to have any direct relation.

So I would appreciate if someone can give me a lead on where this claim may come from.

Atapuerca skulls show "intermediate" features

H. heidelbergensis from Atapuerca
Cranium 5 "Miguelón"
(CC by José Manuel Benito)
This has been in the news all around this week with various emphasis, but probably the most important highlight is that, according to Atapuerca researchers, Homo heidelbergensis may well be a diffuse category with varied degrees of affinity to their Neanderthal successors.

J.L. Arsuaga et al., Neandertal roots: Cranial and chronological evidence from Sima de los Huesos. Science 2014. Pay per viewLINK [doi:10.1126/science.1253958]


Months ago, it was found that Atapuerca's H. heidelbergensis and the Denisova hominins formed a single mitochondrial DNA clade to the exclusion of Neanderthals and us. However Arsuaga et al. find that facial traits in the hominins of Sima de los Huesos seem to be already much closer to those of Neanderthals than to the local precursors. Instead other cranial traits such as brain size do not seem to change yet. 

There seems to be some uncertain speculation by the researchers on what this partial "neanderthalization" process in Atapuerca hominins could signify. 
"We think based on the morphology that the Sima people were part of the Neanderthal clade," Arsuaga said, "although not necessarily direct ancestors to the classic Neanderthals."

This, I guess, could indicate some sort of convergent evolution or be caused by some Neanderthal admixture on the male side.
 
Another important finding is that, contrasting with the similitude of the various specimens from Sima de los Huesos ("Chasm of the Bones", a key subsite of Atapuerca), other contemporary European specimens look quite different, suggesting that H. heidelbergensis was a quite diverse human species.

The study includes seven new specimens, as well as ten other previously reported ones.

Atlas of Inuit trails

An anthropological and geographical resource that may be of interest:


The atlas seems so far mostly limited to Nunavut and other parts of Northern Canada.

From the Introduction:
The Atlas provides a synoptic view (although certainly incomplete) of Inuit mobility and occupancy of Arctic waters, coasts and lands, including its icescapes, as documented in written historical records (maps of trails and place names). 

The documents that form the foundation of this Atlas consist of both published and unpublished accounts of Inuit engagement with cartography during the 19th and 20th centuries. All documents are held in public libraries or archives. The focus of the Atlas in this initial project is on material from the Eastern and Central Canadian Arctic. It is hoped that the Atlas can be further developed in subsequent phases to present material of other Inuit groups such as the Inupiat, Inuvialuit, and peoples of Nunatsiavut (Labrador) and Nunavik. 

Delineations of trails and place names play a critical role in documenting the Inuit spatial narratives about their homelands. To show where these trails lead and connect to other trails, the historical records used in making this Atlas are being relationally linked, referenced geospatially, and displayed on a base map.


Partial image of the atlas

June 15, 2014

Mexico's Native American diversity

Interesting study on Mexico's Native American diversity:

Andrés Moreno Estrada et al., The genetics of Mexico recapitulates Native American substructure and affects biomedical traits. Science 2014. Freely available with registrationLINK [doi:10.1126/science.1251688]
Abstract

Mexico harbors great cultural and ethnic diversity, yet fine-scale patterns of human genome-wide variation from this region remain largely uncharacterized. We studied genomic variation within Mexico from over 1000 individuals representing 20 indigenous and 11 mestizo populations. We found striking genetic stratification among indigenous populations within Mexico at varying degrees of geographic isolation. Some groups were as differentiated as Europeans are from East Asians. Pre-Columbian genetic substructure is recapitulated in the indigenous ancestry of admixed mestizo individuals across the country. Furthermore, two independently phenotyped cohorts of Mexicans and Mexican Americans showed a significant association between subcontinental ancestry and lung function. Thus, accounting for fine-scale ancestry patterns is critical for medical and population genetic studies within Mexico, in Mexican-descent populations, and likely in many other populations worldwide.

Fig. 1-D
First of all it has to be highlighted that the sentence "some groups were as differentiated as Europeans are from East Asians" is a bit misleading. It refers to the raw FST parameter (Fixation Index) which in these cases is caused by extreme drift, product of isolation and small number endogamy.

Otherwise the Seris (Comcaac), who are the only population affected by the claim, are clearly derived not only from the same root as the rest of Native Americans but more specifically from the ancestor population of the Tarahumaras (Rarámuri), as fig.1-D reflects (right). 

The Seris are a small population of coastal Sonora who add up to less than one thousand people and have remained proudly distinct, not only from the colonial population but also from other fellow Native Americans. In spite of this long extreme isolation that makes the appear "as differentiated as Europeans are from East Asians", it is apparent that they must derive from the Uto-Aztecan populations of NW Mexico (and maybe also across the border). 

K=9 (fig. 2-B-part)
Other very isolated and heavily drifted populations are the Lacandon and Tojolabal Mayas. Again, in spite of their radical isolation, they seem related to other Mayas by origin. In these cases their languages are recognized as members of the Maya family, while the Seri language is considered an isolate. 

Actually the extreme FST scores only apply between these extremely drifted populations: FST{Seri-Lacandon}=0.136, FST{Seri-Tojolabal}=0.121. 

This reference is interesting because it explains how subcontinental levels of differentiation can happen in relatively short time if the founder populations are small and isolated for some 20 Ka. It is a warning call against reaching to too many conclusions based only on populations with a long history of isolation.

Otherwise the Seri FST scores are high but more normal: 0.087 to 0.096.  See table S-4 for further details. 

The tree is interesting also because it suggest a main division separating the Nahuas from the rest of the Uto-Aztecan meta-population (Saris included). The Nahuas, who approximately correspond to the the ancient Aztecs, are actually divided in several groups, which seem rather akin to their immediate neighbors and not so much among them or their linguistic relatives. 

This implies that, as the ancestors of the Nahuas migrated southwards, they assimilated so many locales that they largely lost their distinctiveness. In the ADMIXTURE graph to the left, we see that they do keep a variably small fraction of Uto-Aztecan affinity (not just them, also the Purepecha and Totonac, whose languages are distinct). 

Otherwise Mexican Natives have two main components at K=9: the main Mexican one (blue) and the Maya one (orange). The Maya division is also apparent in the tree. 

However it must be mentioned that the ADMIXTURE run available in the supp. materials (fig. S-10) reaches down to K=20, showing further differentiation between the various Mesoamerican populations dominated by the blue components at K=9. 

For comparison, in the European segment only the Basque component shows up as distinct in all those runs (since K=10). So we are talking about a fairly diverse population compared with European relative homogeneity.

Sequence of further components or distinctions showing at depths greater than K=9:
  • K=12: Tarahumara
  • K=14: Nahua-Purepecha-Totonac
  • K=15: Tepehuan
  • K=16: Purepecha + Jalisco-Nahua
  • K=18: Triqui
  • K=20 Totonac


Mestizo ancestries

An issue worth mentioning, particularly in relation to the so far unconfirmed but quite plausible Canarian origin of a large share of the "European" ancestry in the Caribbean region, is that the European ancestry of Mexicans seems essentially Iberian, as shown in fig. S-14:


I am anyhow awaiting for a sensible geneticist to address this question properly. When dealing with Mexicans and other Latin American populations of complex colonial ancestry, it seems quite apparent that so diverse European samples are in excess and that instead a North African control is surely missing instead.

A more regionalized approach to Iberian ancestry could also be interesting.

Regarding the Native American share of the ancestry, a finding of this study is that there is important regional variation: Yucatan and Campeche Mexicans have clearly strong Maya ancestry, while in Sonora it is something more like Tarahumara and in the core of Mexico it seems Nahua-like or from other "central" populations like the Zapotec or Totonac. See fig. 2A for details.

There is also very minor Tropical African ancestry across the board, somewhat more relevant in Guerrero and Veracruz, states which historically hosted the main port cities of New Spain and still have some small Afrodescendant populations.

June 14, 2014

Ancient inter-continental admixture in the Horn of Africa

A new and quite interesting study finds strong support for Upper Paleolithic (~ LSA) Eurasian inflows into the Horn of Africa and confirms that most of the populations of that region are in essence an ancient mix of West Eurasian and African ancestries.

Jason A. Hodgson et al., Early Back-to-Africa Migration into the Horn of Africa. PLoS Genetics 2014. Open accessLINK [doi:10.1371/journal.pgen.1004393]
Abstract

Genetic studies have identified substantial non-African admixture in the Horn of Africa (HOA). In the most recent genomic studies, this non-African ancestry has been attributed to admixture with Middle Eastern populations during the last few thousand years. However, mitochondrial and Y chromosome data are suggestive of earlier episodes of admixture. To investigate this further, we generated new genome-wide SNP data for a Yemeni population sample and merged these new data with published genome-wide genetic data from the HOA and a broad selection of surrounding populations. We used multidimensional scaling and ADMIXTURE methods in an exploratory data analysis to develop hypotheses on admixture and population structure in HOA populations. These analyses suggested that there might be distinct, differentiated African and non-African ancestries in the HOA. After partitioning the SNP data into African and non-African origin chromosome segments, we found support for a distinct African (Ethiopic) ancestry and a distinct non-African (Ethio-Somali) ancestry in HOA populations. The African Ethiopic ancestry is tightly restricted to HOA populations and likely represents an autochthonous HOA population. The non-African ancestry in the HOA, which is primarily attributed to a novel Ethio-Somali inferred ancestry component, is significantly differentiated from all neighboring non-African ancestries in North Africa, the Levant, and Arabia. The Ethio-Somali ancestry is found in all admixed HOA ethnic groups, shows little inter-individual variance within these ethnic groups, is estimated to have diverged from all other non-African ancestries by at least 23 ka, and does not carry the unique Arabian lactase persistence allele that arose about 4 ka. Taking into account published mitochondrial, Y chromosome, paleoclimate, and archaeological data, we find that the time of the Ethio-Somali back-to-Africa migration is most likely pre-agricultural.

The study makes three different formal admixture tests (f3, Adler and D-stat), as well as a Rolloff simulation, in order to confirm these findings. This part is quite technical and therefore I am not going to discuss it further. Feel free to explore the extensive supplemental materials. 

I will instead stop on what I know better, which is ADMIXTURE and FST distances, which are more visually amenable and ultimately tell the same story. 

Figure 2. Population structure of Horn of Africa populations in a broad context.
ADMIXTURE analysis reveals both well-established and novel ancestry components in HOA populations. We used a cross-validation procedure to estimate the best value for the parameter for the number of assigned ancestral populations (K) and found that values from 9 to 14 had the lowest and similar cross-validation errors (Figure S2). (A) The differences in inferred ancestry from K = 9–14 are most pronounced in the HOA for K = 10–12, where two ancestry components that are largely restricted to the HOA appear (the dark purple and dark green components). (B) Surface interpolation of the geographic distribution of eight inferred ancestry components that are relatively unchanging and common to the ADMIXTURE results from K = 10–12. (C) Individual ancestry estimation for HOA populations (with language groups indicated) and surface plots of the changing distributions of the Nilo-Saharan (light blue) and Arabian (brown) ancestry components for K = 10–12. At K = 11, a new HOA-specific ancestry component that we call Ethiopic appears (dark purple) and at K = 12 a second new ancestry component that we call Ethio-Somali (dark green) appears with its highest frequencies in the HOA.

Above we have the original presentation of ADMIXTURE results for K=10-12. It must be said that the cross validation score is lowest (optimal) for K=12 but that this value is only slightly smaller than those for K=9-14, which make a plateau (fig. S2). 

Therefore their use of K=10 and K=11 is justified, particularly because it is also interesting to turn off the old amalgamation reflected in the Ethiopic (Ari, Woloytta) and Ethio-Somali (Cushitic, Ethiopian Semitic) components, and that is done by using K=10 instead of the optimal K=12.

This issue is best perceived in the FST distances table (within text S1), which I include here with some convenient annotations:


The red-orange colored frames (as well as the red notes on the components) in the table above were added by me to better illustrate the meaning of these FST values:
  • The red frames capture two groups of components with very low differences (<50): West Asia-Europe and West-East Africa.
  • The dark orange frames indicate other two groups with quite low distances (<70): South-Central Asian and the West Eurasian core.
  • The lighter orange frames indicate large clusters of middling distances (<125) of continental nature: Eurasian and African. 
  • Intercontinental FST scores are systematically larger, for example European-West African is 176, while European East African ("Nilo-Saharan") is 172, only slightly smaller. 
K=12
It is quite apparent that there are three components that overflow these continental boundaries:
  • The so-called Mahgrebi (North African) has some extra affinity with the Ethiopic (Omotic) component, and vice versa. These two components fall otherwise within my approximative continental boxes but they still show lower scores for all the other components of the other "box". This is consistent with their nature as Afro-Eurasian admixed components, each with its own proportions.
  • The Ethio-Somali (Cushitic?) component is actually more intermediate than the previous ones: although its strongest affiliation is towards Eurasia and particularly with the North African and Arabian components, it also shows strong affinity with the core African components (East and West African, i.e. Nilo-Saharan and Niger-Congo). This is consistent with the other evidence in this study that reveals it as an ancient Afro-Asian mix.
I must mention here that some of the labels used by the authors are not at all the ones I would have chosen and this is particularly true re. the Nilo-Saharan (light blue) component, which peaks among the Sandawe (Aboriginal East Africans from Southern Tanzania, speaking a click language), the Anuak (Nilo-Saharan Ethiopians) and the Gumuz (other Ethiopians of quite dubious Nilo-Saharan linguistic affiliation). Hence I prefer to call it East African or East African 1

The authors conclude with the following remarks (emphasis mine):
We find that most of the non-African ancestry in the HOA can be assigned to a distinct non-African origin Ethio-Somali ancestry component, which is found at its highest frequencies in Cushitic and Semitic speaking HOA populations (Table 2, Figure 2). In addition to verifying that most HOA populations have substantial non-African ancestry, which is not controversial [11][14], [16], we argue that the non-African origin Ethio-Somali ancestry in the HOA is most likely pre-agricultural. In combination with the genomic evidence for a pre-agricultural back-to-Africa migration into North Africa [43], [61] and inference of pre-agricultural migrations in and out-of-Africa from mitochondrial and Y chromosome data [13], [32][37], [47], [99][102], these results contribute to a growing body of evidence for migrations of human populations in and out of Africa throughout prehistory [5][7] and suggests that human hunter-gatherer populations were much more dynamic than commonly assumed.

We close with a provisional linguistic hypothesis. The proto-Afro-Asiatic speakers are thought to have lived either in the area of the Levant or in east/northeast Africa [8], [107], [108]. Proponents of the Levantine origin of Afro-Asiatic tie the dispersal and differentiation of this language group to the development of agriculture in the Levant beginning around 12 ka [8], [109], [110]. In the African-origins model, the original diversification of the Afro-Asiatic languages is pre-agricultural, with the source population living in the central Nile valley, the African Red Sea hills, or the HOA [108], [111]. In this model, later diversification and expansion within particular Afro-Asiatic language groups may be associated with agricultural expansions and transmissions, but the deep diversification of the group is pre-agricultural. We hypothesize that a population with substantial Ethio-Somali ancestry could be the proto-Afro-Asiatic speakers. A later migration of a subset of this population back to the Levant before 6 ka would account for a Levantine origin of the Semitic languages [18] and the relatively even distribution of around 7% Ethio-Somali ancestry in all sampled Levantine populations (Table S6). Later migration from Arabia into the HOA beginning around 3 ka would explain the origin of the Ethiosemitic languages at this time [18], the presence of greater Arabian and Eurasian ancestry in the Semitic speaking populations of the HOA (Table 2, S6), and ROLLOFF/ALDER estimates of admixture in HOA populations between 1–5 ka (Table 1).
K=12 detail for a fraction of the Horn of Africa and distribution of the four main components

June 11, 2014

China and Mexico go open access

In China the Academy of Science has made compulsory to deposit research in open access publications 12 months after the original publication in a pay per view one. In Mexico new legislation will affect in the same way to all studies partly financed by public funds. 

Via BMC newsletter.


June 9, 2014

The oldest know rope and spoon

Noticias de Prehistoria-Prehistoria al Día[es] mentions this week two quite impressive archaeological findings that illustrate the richness of the lives of our remote ancestors.

Ardales petrified rope
A petrified rope (right) was found in the cave of Ardales (Andalusia). The rope now transformed into stone by the same mechanism that forms stalactites was apparently tended to allow access to a remote section of the cave rich in rock art. 

Other findings are several fixed lamps created by the breaking of stalagmites, as well as several portable lamps found earlier in the research. In these lamps marrow or wax was burned. 

The rope has been indirectly dated to c. 30 Ka BP, what in Southern Iberia would still be the Aurignacian period.

Evidences of ropes of slightly more recent age are also known from Moravia (Gravettian) thanks to patterns left on their famous terracotta figurines.

The other not less spectacular finding comes from Russia, where an ivory spoon was found in Avdeevo cave, near Kursk. It belongs to the Gravettian period and is dated c. 23-22 Ka BP. 

The same site also provided a beautiful spatula almost identical to another one previously found in Kostenki, as well as other materials including a "Venus" figurine.

These findings illustrate the wealth of creativity displayed by the Paleolithic hunter-gatherers, not so different from ours after all.

Avdeevo ivory spoon

June 7, 2014

Y-DNA macro-haplogroup K-M526 originated in Indonesia

Most probably did, although there is always some uncertainty. This is what a new study demonstrates almost beyond doubt.

Tatiana M. Karafet et al., Improved phylogenetic resolution and rapid diversification of Y-chromosome haplogroup K-M526 in Southeast Asia, EJHG 2014. Pay per viewLINK [doi:10.1038/ejhg.2014.106]

It also demonstrates that "Australasian" haplogroups M and S, as well as several other K sublineages from that area belong to the same subhaplogroup, "brother" of P and "cousin" of NO. 

The sample, focused in SE Asia and Oceania, is quite massive (4413 K-M526 samples) so there is very limited chance that further studies will produce major changes in this understanding. However there are some geographic blanks like Myanmar which can produce surprises when they are finally properly studied. Mitochondrial DNA from the Bamar (ethnic Burmese) showed in a recent study to have very high top-level diversity, suggesting that their ancestors played some key role in the formation of the peoples of Asia and beyond. 

But while we await for those future studies or even the political chance to perform them, let us see what this excellent paper can tell us.

First of all the new data allows for a re-drawing of the K haplogroup tree, including renaming proposals:


For easier understanding, I annotated in red the new version of the tree with the populations carrying each of the sublineages in SE Asia and Australasia (but excluding island Oceania because of its recent colonization date and simplicity). I also annotated in green the proposed timeline of formation of various nodes downstream of K, per this study:


The presence of so many basal haplogroups and paragroups (signaled with an asterisk) in Island SE Asia makes compulsory to accept that K2 (formerly known as K(xLT) or MNOPS and right now listed in ISOGG as just K) but also its descendants K2b, K2b1 and K2b2 (P) must have originated in what is now the Malay Archipelago but was once a large emerged peninsula known as Sundaland

This is my reconstruction of the likely centroids of K2 sublineages (named) and the K2* paragroup (stars):


The map originally included several work layers in order to analyze the geographical scatter of the downstream haplogroups within K2b but, for visibility reasons, I chose to to make them invisible. 

Instead I made the following map of approximate plausible routes for the various sublineages of K2:


I must say that K-247, labeled as K2e here but reported as close relative of NO in a previous study, which named it "X", and which is found only in India (reported in two men) may add some extra complexity to the K2a (NO) arrow. It is for example possible that K2a'e and P migrated northwards jointly, splitting ways somewhere in Indochina (K2e migrating to India with P1 and maybe some already formed Q remaining in Indochina as well). This matter however requires more investigation and so far other possibilities such as later independent minor flows between South and SE Asia are equally likely.

Although not detailed enough to capture the nuances of the rare basal sublineages found in the various populations of Island SE Asia, this map may be of help for some in order to illustrate the importance of patrilineal haplogroup K-M526 globally:


Overall this study underlies and vindicates my repeated claim of SE Asia playing also an important role in the formation of the Asian+ branch of Humankind, together with South Asia. Something I have repeatedly suggested is that mtDNA macro-haplogroup N appears to have coalesced in SE Asia, while its most prolific "daughter" R instead seems original from South Asia, but that both have left a legacy East and West of the Brahmaputra regional divide. 

I am not sure on how exactly couple mtDNA N/R with the spread of Y-DNA K2 but it seems almost certain that they are related to a great extent. 

I also suspect that the Toba supervolcano catastrophe may well have caused enough damage to allow for a sudden expansion of one or several human populations after it. I would think that the Toba catastrophe marks the beginning of the expansion of Y-DNA K2 and mtDNA N, although it is quite possible that some other lineages like C were also involved in secondary roles in this secondary, yet so influential, expansion in Asia and Oceania.

Another possible element which may have aided this expansion could be dog domestication, which, although so far cannot be documented before 33,000 years ago in Altai, is suspected to have happened first in SE Asia.

West-East admixture in Mongolian Altai in the Bronze Age

This new study found West-East Eurasian admixture in Mongolian Altai before the Iron Age. This finding partly contradicts previous data by González-Ruiz 2012 that suggested a strict genetic divide until the Iron Age.

Clemence Hollard et al., Strong genetic admixture in the Altai at the Middle Bronze Age revealed by uniparental and ancestry informative markers. FSI Genetics 2014. Pay per viewLINK [doi:10.1016/j.fsigen.2014.05.012]

The new data comes from two kurgan burial sites in Westernmost Mongolia: Tsagaan Asga and Takhilgat Uzuur-5 (abbreviated as TA and TU respectively).


In both sites mtDNA lineages have dual origins, although in TU (close to the Russian and Khazakh border) there is some prevalence of Western matrilineages (3/5), while in TA (somewhat farther East) the opposite is true instead (3/7 Western matrilineages), suggesting some clinality. 

On the other hand Y-DNA is totally dominated by Western lineages with a single exception (C), although these Western lineages (Q and R1a) are of Central Asian/Siberian type without exception. Of course, Q variants have been lingering in Central Asia, Siberia and some parts of East Asia almost certainly since Aurignacian, being part of the early genesis of Native Americans (see here for a more in-depth discussion and here for China's Neolithic Y-DNA, which includes some Q), while R1a-Z93 seems a more recent arrival, maybe Epipaleolithic or Neolithic (see here), but both seem to have their origins in or near Iran, judging on basal diversity. 

There is no trace of European-specific inflows on the Y-DNA side, even if some of the mtDNA lineages may be thought as having this origin (H1, H7, U4).

The Eastern ancestry is all typical of NE Asia. I would pay particular attention to mtDNA D, which seems to have spread in the Taiga with the Seima-Turbino phenomenon, which inaugurated the Bronze Age in that area and is believed to originate in Altai.

So, as conclusions, we can say that:
  1. There was incipient East-West admixture in parts of Altai already in the Bronze Age, the main actor of this admixture were females.
  2. Patrilineal ancestry was essentially "Western" of the kind that must have been in Altai since the Neolithic or earlier (i.e. not European but Central Asian of West Asian affinities/origins)
  3. The cultural context is Kurgan, strongly suggesting Indoeuropean language (of the Tocharian branch probably).
  4. The Seima-Turbino link however suggests some sort of affinity with carriers of the mtDNA D lineage in the Taiga in that same period, lineage not found further West in Altai. These Siberian Bronze Age vector people were very likely of Tungusic ethnicity. Although early Turkic connections cannot be totally ruled out, in general Turkic peoples seem more associated to the steppe instead and the roots of their expansion were probably forged some centuries later, already in the Iron Age. 
  5. Both in the expansion of Indoeuropean eastwards and later in that of Altaic languages and ethnic affiliation westwards, the Altai region seems to have played a key pivotal role. However modern Altaians, even if Turkic by language, retain almost integrally the same Y-DNA genetic signature as the Bronze Age peoples mentioned here, what underlines their capacity to cross ethno-linguistic lines once and again while keeping their patrilineal ancestry nearly unaffected. They are therefore a good example of how populations can change ethno-linguistic ascription without significant genetic flow in such a key factor as the patrilineages. Surely many other peoples did the same in many other geographies. Ancestry and language need not to be linked, even if they sometimes are.

June 6, 2014

PPNB ancient mtDNA and its legacy

There are several interesting studies in my "to do" list and I will be commenting them in the following days (I am quite busy these weeks and therefore I concentrate my efforts on weekends).

In this entry we have a rather interesting analysis of ancient mtDNA from the Pre-Pottery Neolithic B of Syria (NE and South) and its legacy on modern populations of West Asia and SE Europe, as well as on ancient European Neolithic ones.

Eva Fernández et al., Ancient DNA Analysis of 8000 B.C. Near Eastern Farmers Supports an Early Neolithic Pioneer Maritime Colonization of Mainland Europe through Cyprus and the Aegean Islands. PLoS Genetics 2014. Open accessLINK [doi:10.1371/journal.pgen.1004401]

I understand that the sequences are not really new but that they were first discussed in Fernández 2005 (thesis in Spanish) and 2008. What is new is the comparison with ancient and modern populations in search of their possible legacy.

Early PPNB (from CONTEXT C14 database)
In spite of the relevance of this analysis, it must be cautioned that the Tell Ramad and Tell Halula sites may not be fully representative of the actual genetic diversity of PPNB as a whole, a cultural area that spanned all the Levant, from the Kurdish mountains to the Sinai and Cyprus.

If, as the authors argue and I have already suggested in relation to the NE African affinities of European Neolithic ancestry, the arrival of Neolithic to Thessaly happened via a coastal route, inland PPNB sites may well not be as informative as Palestinian or Cypriot ones.

But this is what we have for now, so let's see what these ancient Syrian farmers tell us, while we await further Neolithic sequences from potentially more relevant sites.

Table 1. Mitochondrial DNA typing of 15 Near Eastern PPNB skeletons.

40% of the sequences belong to haplogroup K, a U8-derived lineage unknown in Europe before the Neolithic. Most of the other lineages (40%) belong to R0 but half of them belong to R0(xHV), extremely rare in Europe (common in Arabia instead) and the H sequences cannot be identified either with anything common nowadays. The remaining 20% of lineages (U*, N* and L3*) are not too helpful either.

So when the authors compare them with modern and ancient populations most of the affinity corresponds to a single basal haplotype of K (16224C,16311C) as described in supplementary table 5.

Figure 2. Contour map displaying the percentage of individuals of the database carrying PPNB haplotypes.
Only populations with clear geographic distribution were included. Gradients indicate the degree of similarity between PPNB and modern populations (dark: high; clear: small).

The SE European and West Asian populations with the greatest legacy of this haplotype are: the Csángó of Moldavia (22%), Cypriots (13%), Ashkenazi Jews (11%), Crimean Tatars (10%) and Georgians (9%). Cardium Pottery farmers from Catalonia (23%) and a pooled Central European Danubian Neolithic sample (10%) also score high for this lineage.

Some other PPNB matrilineages also show some lesser modern prevalence:
  • 16223T (L3) → Qatar, Yemen (not necessarily the same L3(xM,N) lineage, it must be said)
  • 16224C,16311C,16366T (K) → Druze
  • 16256T (H) → Bedouin
The other haplotypes have not been detected in modern nor European Neolithic populations.

The obvious conclusion is that only the 16224C+16311C K haplotype was, of all the Euphrates PPNB lineages active in the Neolithic European founder effect. This haplotype was present only in 1/15 individuals from the Euphrates PPNB, so rather marginal over there, although a close relative found today among the Druze was more common (3/15).

Another conclusion is that the Csángó probably have a quite direct line of ancestry to the early European farmers, shedding some light on the origin of this mysterious population at risk of extinction.

The coastal route to Thessaly proposed here makes all sense to me because, on one side, early Anatolian Neolithic cultures do not seem to have any obvious cultural affinity with the first European Neolithic of Sesklo (Painted Pottery) and Otzaki (Cardium Pottery), and, on the other side, there is clear evidence of some NE African genetic legacy mediated by Palestine: Y-DNA E1b-V13 naturally but also the "Basal Eurasian" speculation of Lazaridis that ended up being revealed as Dinka affinity in fig. S7 of Skoglund & Malström.

This theory can only be strongly confirmed if Palestinian and Cypriot ancient DNA is sequenced and fits well in it. Similarly ancient Balcanic DNA would be most interesting to have as well for a more direct reference. But, in any case, the theory seems at the very least plausible and supported by some important evidence.

My hypothetical reconstruction of a plausible coastal route of Neolithic towards Thessaly (dashed red line)
on a base map of Middle PPNB from the CONTEXT database.

It is also important to notice that the Syrian PPNB sequences are different from the modern mtDNA pool of West Asia, dominated by lineages like J, T1 and U3. This suggests that, at the very least in this region of the Syrian Euphrates, there have been important demographic changes since Neolithic, something confirmed by data from the same are but of later dates (which anyhow is not yet modern either). 

Fernández et al. discuss this issue in some detail:
Our PPNB population includes a high percentage (80%) of lineages with a Palaeolithic coalescence age (K, R0 and U*) and differs from the current populations from the same area, which exhibit a high frequency of mitochondrial haplogroups J, T1 and U3 (Table S7). The latter have been traditionally linked with the Neolithic expansion due to their younger coalescence age, diversity and geographic distribution [11], [12], [49]. In addition to the PPNB population, haplogroup T1 is also absent in other Early Neolithic populations analyzed so far [17], [22], [26], [30]. Haplogroup U3 has been found only in one LBK individual and it has been suggested that it could have been already part of the pre-Neolithic Central European mitochondrial background [19].

Haplogroup J is present in moderate frequencies in Central European LBK-AVK populations (11.75%) and it has been proposed as part of the Central European “mitochondrial Neolithic package” [19]. However, it has also been described in one late hunter-gatherer specimen of Germany, raising the possibility of a pre-Neolithic origin [23]. Haplogroup J is present in low frequency (4%) in Cardial/Epicardial Neolithic samples of North Eastern Spain [27], [28], [31]. Absence of Mesolithic samples from the same region prevents making any inference about its emergence during the Mesolithic or the Neolithic. However, its absence in the PPNB genetic background reinforces the first hypothesis.

These findings suggest that (1) late Neolithic or post-Neolithic demographic processes rather than the original Neolithic expansion might have been responsible for the current distribution of mitochondrial haplogroups J, T1 and U3 in Europe and the Near East and (2) lineages with Late Paleolithic coalescent times might have played an important role in the Neolithic expansive process. The first suggestion alerts against the use of modern Near Eastern populations as representative of the genetic stock of the first Neolithic farmers while the second will be explored in depth in the following section.

From the viewpoint of material Prehistory, it is of course correct, that PPNB was overwhelmed by later cultural processes, which may have implied demic expansions and replacements of some sort, even if many of them seem to originate within West Asia.

First of all, there is the Halafian cultural expansion, originating in Upper Mesopotamia; then we also have to consider the Semitic cultural and linguistic expansion, originating in Palestine; finally we have to consider the Indoeuropean waves: first the Anatolian group (Hittites, etc.) via the Caucasus, later the Balcanic group of Phrygians (and probably Armenians as derived branch) and finally the Iranian one from Central Asia. Even within the Semitic expansion there were probably several waves as well. All together must have significantly reshuffled the genetic landscape of the region. 

But unless we get more ancient West Asian DNA it will be most difficult to discern clearly how all that played out. After all the Syrian Euphrates can be exceptional in many aspects, being right in the middle of all: a true pivot of the Fertile Crescent, subject to pressure from all directions. 

June 2, 2014

A genetic actor for blond hair in Eurasia

Interesting find on hair color genetic determination, which must be understood nonetheless as only one factor among several in this aspect.

Catherine A. Guenther et al., A molecular basis for classic blond hair color in Europeans. Nature Genetics 2014. Pay per viewLINK [doi:10.1038/ng.2991]

Abstract

Hair color differences are among the most obvious examples of phenotypic variation in humans. Although genome-wide association studies (GWAS) have implicated multiple loci in human pigment variation, the causative base-pair changes are still largely unknown1. Here we dissect a regulatory region of the KITLG gene (encoding KIT ligand) that is significantly associated with common blond hair color in northern Europeans2. Functional tests demonstrate that the region contains a regulatory enhancer that drives expression in developing hair follicles. This enhancer contains a common SNP (rs12821256) that alters a binding site for the lymphoid enhancer-binding factor 1 (LEF1) transcription factor, reducing LEF1 responsiveness and enhancer activity in cultured human keratinocytes. Mice carrying ancestral or derived variants of the human KITLG enhancer exhibit significant differences in hair pigmentation, confirming that altered regulation of an essential growth factor contributes to the classic blond hair phenotype found in northern Europeans.

The study, quite technical, is mostly about mice (a close relative of primates and hence humans) in which a SNP in the same non-coding upstream position relative to the Kitl gene (equivalent to the human KITLG) causes white hair coloration. In the case of some humans it seems to work almost exactly the same way, causing blond coloration of hair, a change already apparent in the mouse embryos.

Figure 1: A distant regulatory region upstream of the KITLG gene controls hair pigmentation in humans and mice.
(b) Frequency distribution of rs12821256 in different populations. The G allele associated with blond hair (yellow) is most prevalent in northern Europe. Green color represents the frequency of the ancestral A allele.

The distribution of the rs12821256-G allele is consistent with the presence of blond hair, including a small slice in SE Asia, where blond hair is known to happen even if rarely. 

However looking particularly at West Eurasia there is still a lot of unexplained blond hair: this allele is most common in England, which is not such an outstanding region for blond hair pigmentation, with highest phenotype frequencies concentrated around the Baltic instead. Basque blondes (which are quite a few) are absolutely unexplained by this particular allele, for example. 

So there must be necessarily other SNPs involved in blond hair formation. One of them was discovered in 2012 among Australasians but it is not found in the mainland apparently. The rest are still unknown.